We were challenged this week to try out a new digital tool or app we have never used before. As I scrolled through the list,, one app popped out right away, Piktochart, an online app that claims to be the latest AI powered infographic maker. With my learning project focusing on teacher AI programs this felt like destiny and I signed up for the free version. I also knew I would need a screen capture tool to document my exploration and initially settled on Lightshot, a google extension and that is where I encountered my first problem.
I have downloaded several google extensions and they work like a charm but while the Lightshot feather is in the toolbar it does nothing.  I closed down all my browsers, tried again and nope. Even restarting had no effect so I turned to the web where I discovered this extension has a very low rating with everyone encountering the same issue, it doesn’t work. Rather than waste anymore time, a quick google search turned up several other options where I settled on Greenshot and oh man what a difference! Quick download complete with directions on how to use it, literally just press the Print Screen prompt and a toolbar appears that is identical to the snipping tool on most PC’s, works exactly the same but with better quality images. After using it today I am saying sayonara to the snipping tool forever!! Now Piktochart on the other hand, not so much.
Initially I was excited about the program and chose to focus on the AI tool located in the upper left of the home screen. When you click on it, a new screen pops up prompting you to describe the topic of your infographic below which I did and clicked the generate button.

It instantly brought up several templates for me to choose from with AI generated content about teacher AI. The template options were very limited (10) and the info generated was extremely vague and repetitive so it quickly became clear that I would definitely need to expand on it quite extensively.

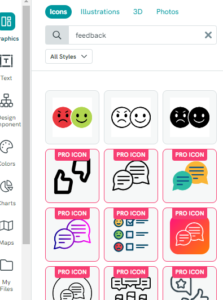
Once in the edit screen I noticed that the layout was very similar to Canva which again got me excited. Ya that was short lived. While editing text and images was just like using Canva, it quickly became apparent that the options for images and graphics were extremely limited without upgrading to the pro version. What was available was very cheesy and depending on what you were looking for there were next to no good options to choose from.
I managed to work through my infographic design highlighting the features of a new AI tool for my learning blog. Once finished, I went to download my project and discovered you only get 2 free downloads. If you need more than that, you need to upgrade so out of curiosity I had a look at the prices and oh my!! $177 USD ($233 CDN based on today’s rate) if you sign up for a full year and pay up front compared to Canva’s $150 CDN. YIKES!!
I wanted to check out some of the program’s other features and consider possible applications for the classroom to see if the cost would be worth it. It does offer a variety of templates from presentations to newsletters, charts and graphs to worksheets. But here’s the thing, the AI tool only works for infographics and you can only preview 5 templates before…you guessed it, you have to upgrade so my ability to really explore classroom applications was limited. While there is some potential this tool could be used in the classrooms to take activities and lessons to the augmentation level and possibly even the beginnings of modification, in my opinion there are much better options out there that can take our teaching easily to the modification level and beyond. This experience was a good reminder that as much as an app might remind us of another one, they are definitely not all created equal.

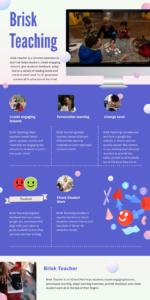
Infographic I created using Piktochart AI Infographic Generator

 I closed down all my browsers, tried again and nope. Even restarting had no effect so I turned to the web where I discovered this extension has a very low rating with everyone encountering the same issue, it doesn’t work. Rather than waste anymore time, a quick google search turned up several other options where I settled on

 and depending on what you were looking for there were next to no good options to choose from.